Gold
Front-Running the Fed: The Gold Setup

THE SETUP
The market isn’t buying gold because it’s afraid. It’s buying gold while conditions are still calm. Equity volatility is low, credit spreads are tight, the yield curve isn’t inverted — and yet large speculative accounts in the gold futures market have built one of their more aggressive net-long positions in recent memory.
That’s the actual story. The speculative side of the futures market has accumulated a large net-long position while growth slows, inflation stays above target, and the Fed has already moved toward easier policy. The one thing missing is falling real yields — the mechanism this whole thesis depends on. This memo walks that setup through our Macro 8 framework and is precise about what’s already confirmed versus what’s still pending.
This isn’t ‘crisis is coming.’ It’s ‘positioning may be front-running a real-yield move that hasn’t finished happening yet.’
1. GLOBAL ECONOMY
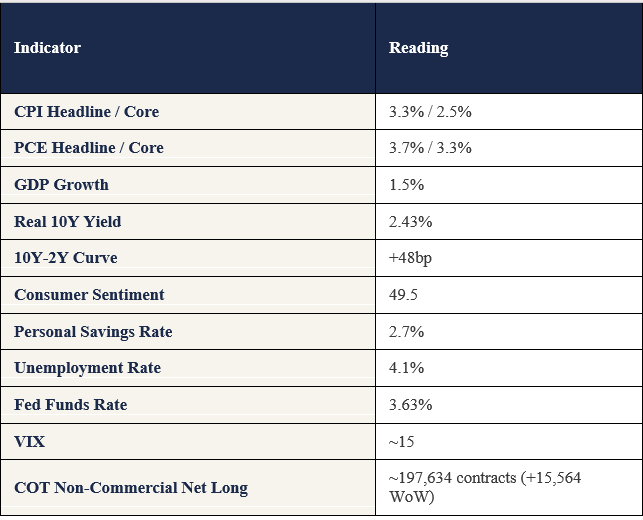
Growth has genuinely decelerated: real GDP rose 1.5% annualized in the second quarter, down from 2.1% in the first. Consumer sentiment tells a more nuanced story. University of Michigan sentiment jumped to 55.2 in July’s final reading, up sharply from June’s 49.5 on easing gas prices — a real improvement. But it’s still roughly 10 to 12% below year-ago levels and near the second percentile of the survey’s history. Weak sentiment isn’t a recession signal on its own, but a reading this low even after rebounding points to a household sector still under strain — reinforced by a savings rate down to 2.7%, climbing consumer credit, and delinquencies ticking up to 2.9%.
What this means for gold
Slowing growth without falling prices removes the two things that usually keep money out of gold: strong growth, which favors equities, and disinflation, which favors bonds. Neither door is fully open.
2. MONETARY POLICY
Fed Funds sits at 3.63%, real movement from the cycle peak. Inflation remains above target on the measure that matters to the Fed: core PCE at 3.3%, headline hotter at 3.7%. Real 10-year yields, though, are elevated — near multi-year peaks, not compressed. The bet is that continued cuts against sticky core inflation eventually squeeze real yields lower, making non-yielding gold more attractive. That’s the mechanism. It hasn’t been confirmed yet.
3. BUSINESS CYCLE
The 10-year/2-year curve is positively sloped — a normalization signal. Unemployment remains relatively low. We’re not going to round this up to “recession” for the sake of a cleaner story. The honest version is a late-cycle economy under real pressure — decelerating growth, a stretched consumer, sticky inflation — that hasn’t tipped over yet.
4. MARKET VALUATION
VIX has been sitting in the mid-teens; credit spreads, investment-grade and high-yield alike, remain low and stable. No fear premium is showing up anywhere else in markets. That’s what makes the positioning data below worth paying attention to — it isn’t being driven by panic.
5. SECTOR LEADERSHIP
Gold miners have shown real, measurable leadership: the VanEck Gold Miners ETF (GDX) surged over 21% in a single week — its best week since 2008 — as gold broke through major downtrend resistance to start August. Market technicians described gold as showing absolute and relative strength even with real rates near multi-year peaks. That’s a sharper claim than “gold is leading”: it’s gold and miners outperforming into a real-rate headwind, which is harder to wave off as noise.
6. POSITIONING
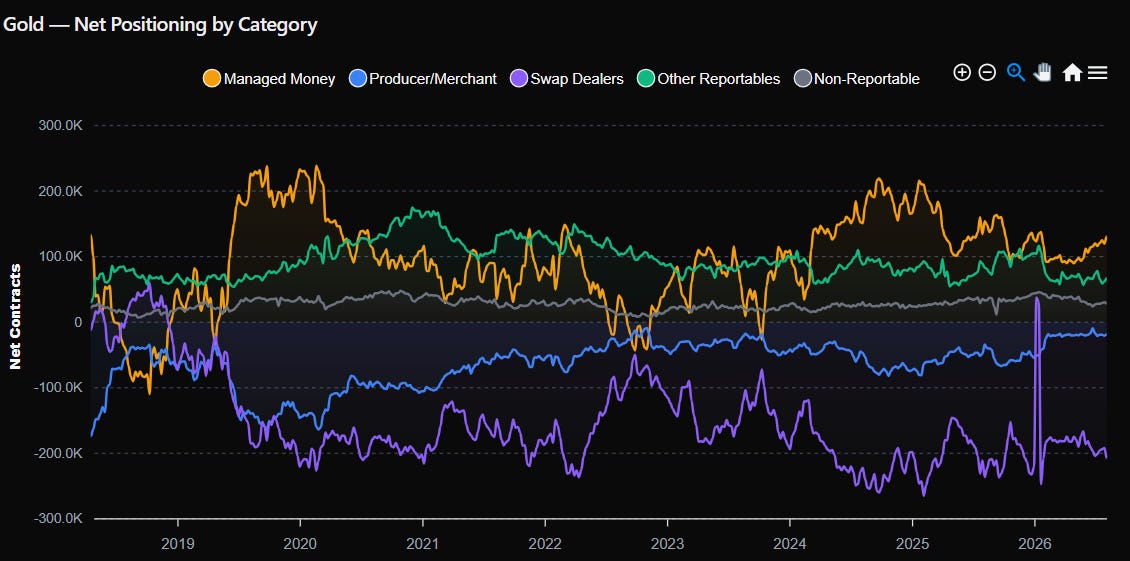
This is the centerpiece, and the numbers are worth stating precisely. Per the CFTC’s August 4, 2026 Commitments of Traders report, non-commercial gold futures accounts — large speculators, hedge funds, commodity trading advisers — held 227,013 long contracts against 29,379 short, a net long of roughly 197,634 contracts. Longs rose 7,391 that week while shorts fell 8,173 — a combined swing of over 15,500 contracts of net length added in a single week.
7. RISKS
Elevated real yields are the central open question: if the Fed pauses or inflation reaccelerates, they could stay elevated or rise, working directly against this setup. A non-inverted curve and calm credit spreads mean the growth-slowdown half of this story has less market confirmation than the positioning data does. And the size of the recent speculative build — over 15,500 contracts in a single week, on top of an already large net long — is itself a risk: that kind of concentrated positioning can unwind fast on a single hot inflation print or a hawkish Fed surprise.
8. CAPITAL ALLOCATION
Here’s the decision tree. If the Fed keeps easing, nominal yields fall, inflation stays sticky, real yields fall, and gold/GDX leadership persists — the thesis confirms and positioning stays constructive. If inflation reaccelerates instead, the Fed turns more hawkish, real yields stay elevated or rise, and the crowded speculative long unwinds — the thesis breaks, and gold/GDX relative strength should break with it.
Given the real-yield confirmation hasn’t arrived and a meaningful share of the recent move sits in fast-building speculative positioning, we’d build exposure in stages rather than all at once — sized to survive a pullback if a hot inflation print pushes back, with room to add as real yields start compressing if cuts continue.
THREE MECHANISMS, NOT ONE PARALLEL
It’s tempting to name a single prior cycle as today’s closest analog. We don’t think that’s honest. Today’s setup borrows pieces of three historical mechanisms without matching any of them exactly.
The 1970s — inflation and negative real rates
Growth stagnated, inflation ran hot for years, real rates went negative. Gold rose more than twenty-fold. Today’s real yields are elevated, not negative — a real difference in degree, even where the direction rhymes.
2008–2011 — aggressive easing into crisis
A financial crisis, not an inflation shock, but the same real-rate channel: aggressive cuts and balance-sheet expansion collapsed real yields. Gold roughly tripled. Today’s easing has been far more measured, with no crisis driving it.
2019–2020 — insurance cuts before a confirmed recession
The Fed cut in 2019 as insurance against slowing growth, before any recession was confirmed — structurally close to today’s cuts arriving against a 1.5% GDP print and a stretched consumer, curve uninverted. But 2019’s inflation was subdued. Today’s mix of weakening growth alongside above-target inflation sits closer to a mild, early-stage stagflationary dynamic, well short of the 1970s in severity.
Today borrows pieces of all three mechanisms without matching any one of them. What they share: real yields eventually falling while someone, somewhere, is still worried about prices.
WHAT WE’RE WATCHING FROM HERE
● Real 10-year Treasury yield — elevated near multi-year peaks; the whole forward-looking case depends on this compressing.
● Core PCE — at 3.3%; a faster decline lets the Fed cut harder, accelerating real-yield compression.
● Gold and GDX relative strength versus the S&P 500 and DXY — the clearest concrete evidence of leadership so far; continuation or failure here matters more than any narrative point.
● 10Y-2Y yield curve — positively sloped today; a move toward inversion would meaningfully strengthen the case.
● CFTC COT net non-commercial positioning — near 197,634 contracts net long after a 15,500-plus contract weekly build; watch for continued accumulation versus a sudden unwind.
● VIX and credit spreads — calm today; a wake-up in either would likely add a second, faster-moving buyer base.
Data Snapshot
The gold thesis isn’t fully confirmed. That’s precisely why we’re interested. The positioning is there. The leadership is there. The macro conditions are developing. Real yields are the final piece.
If that’s the kind of research you want more of, the best way to keep seeing it is to stay subscribed.